9 Out Of 10 Forex Traders Don’t Know How To Find And Profit From Overvalued & Undervalued Currency Pairs
How many times have you placed an indicator like a MACD or some other kind of oscillator on your charts, and tried to trade when this line crosses that line and all that stuff, only to realise that once you are in the trade, it’s almost inevitable that price starts moving against you. Most of these indicators were designed for chart trading back in the eighties when computerised algorithms were not popular. 95% of indicators are just a rehash of old stuff, and is NOT suitable for today’s trading environment.
I knew I had to come up with something of my own, that was simple enough to understand, and anyone else who looks at it could also see the logic within minutes, NOT DAYS OR WEEKs!
I sat down for three whole months and painstakingly went through twenty-four charts going back 30 (and in some cases 40) years mapping out EVERY Support/Resistance and Power area along with some other very important data that influenced the market along with dates, times and what caused the move at that particular time.
As I was undergoing this task. I began to see even more interesting things appearing on the charts. This is when I realised THIS IS HOW THE BANKS TRADE!
Look at a bank chart. Do you see them using out of date or $49.00 Indicators that you can pick up from Ebay to make their decisions?
Many banks have also moved away from fully automated trading and placed the decisions back into the hands of humans. They have to be on top of their game and so do you!
Now you can profit from my overvalued and undervalued currency pair charts just like commercial traders and institutions do.
Welcome to the red knight historical / power levels
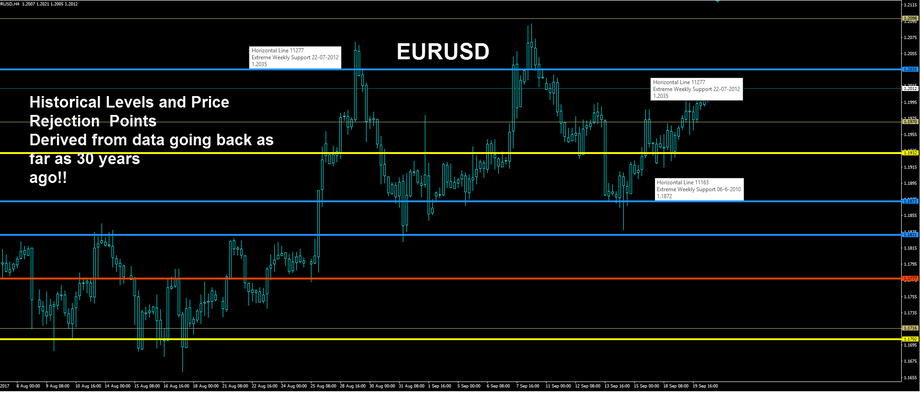
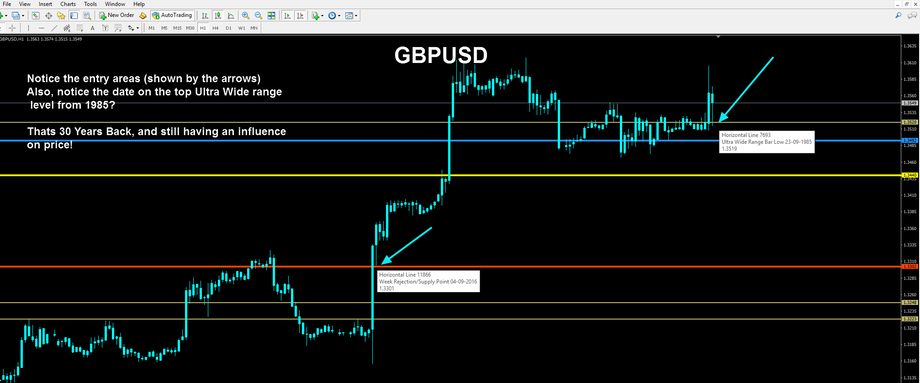
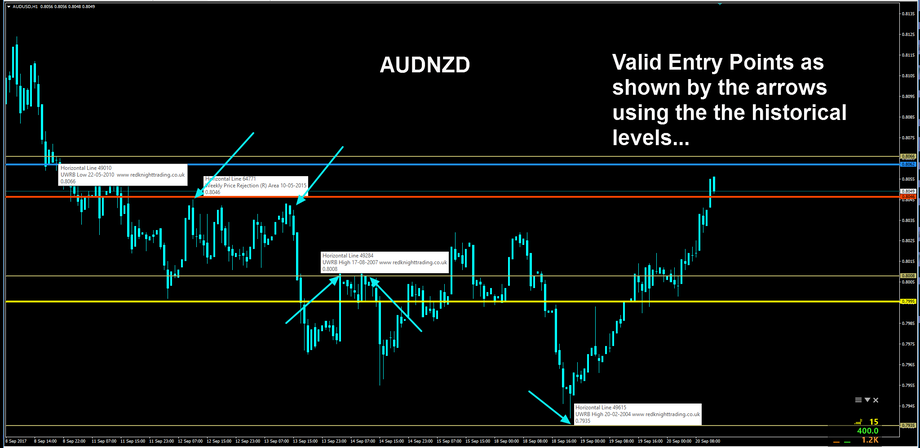
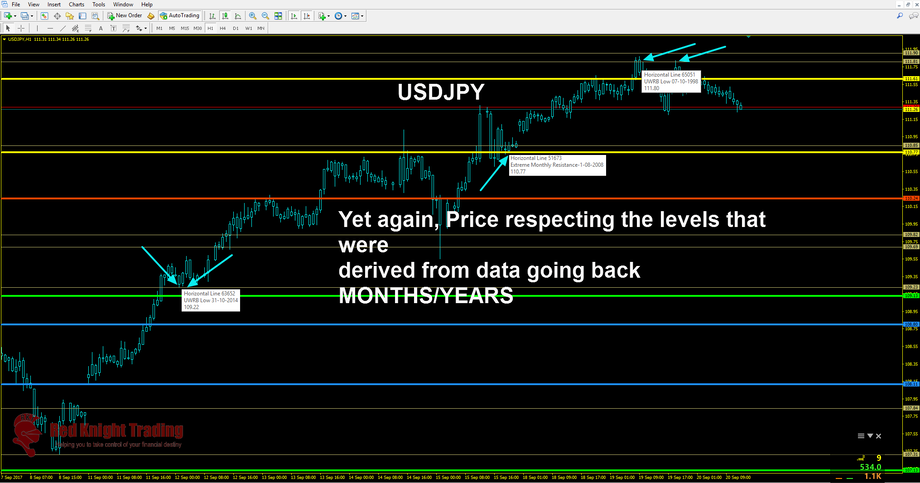
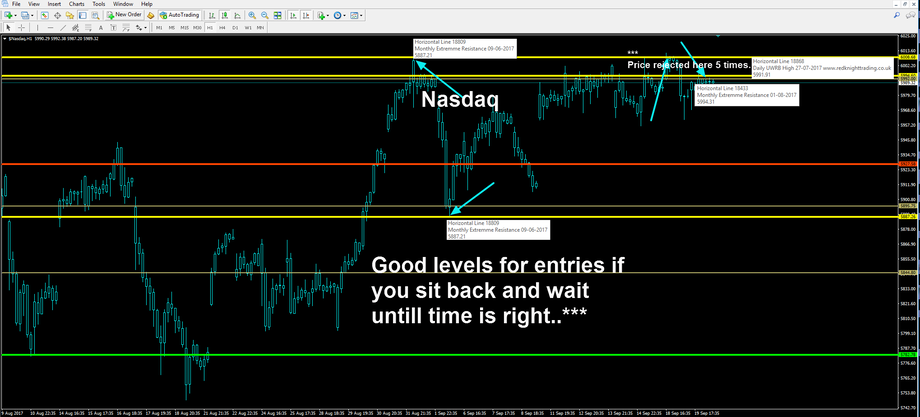
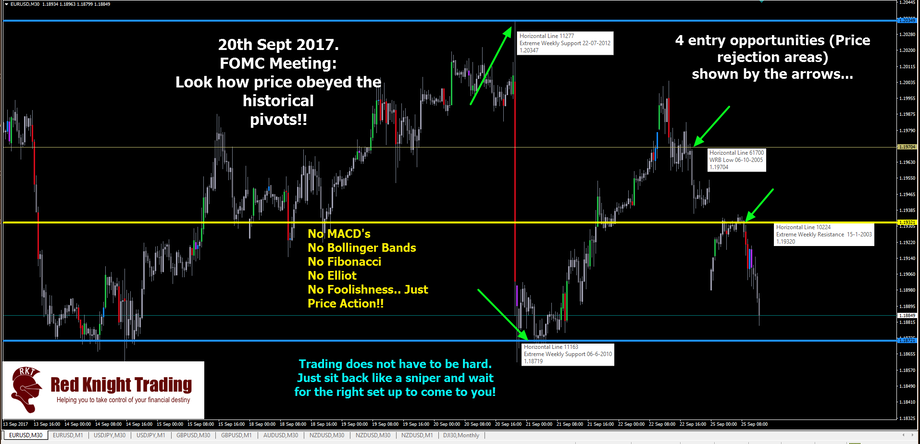
The Redknight Historical Power Levels was developed to help any new or seasoned trader to see with little effort where the banks and institutions are likely to conduct business. Let’s not forget that banks and financial trading institutions including their algorithms have determined areas of interest going back 30-40 years where they would like price to revisit, and the reason is they are continuously probing the markets for new buyers and sellers in these areas. I regularly see when Economic News comes out and price either shoots up 100 pips or tanks 100 pips and hits one of my Rednight Levels to the PIP then reverses off the level!
Uncanny or What?
It’s not about fancy technology. It’s about tried, tested and proven methods.
Take a look at some of the following examples
Without the right Institutional Supply and Demand and True Value Analytic tools, you’ll always be making high-risk trades. And forced to give your trades 20-30 pip price action-based stops so they ‘have room to work out’.
And even worse, you’ll have no idea if and when you should let a trade run or not.
Now you may ask, if I’m achieving success from this stress-free style of trading, why am I sharing it with you?
The reason is you are never going to be in competition with me, and the more people that use these levels, the more all our trades are likely to work out, plus It would be foolish of me not to help others who are struggling to make a profit at this game, not to forget it makes sense to take some risk-free money off the table. It’s a win-win for both parties.
I don’t spend countless hours in front of my monitor any more. I look at my levels, wait until the setup is right, then place my trade (including my stop loss) and walk away!
Most times I’m done within a few hours because I
Get in, Get out ... Get Done!
View our pressure levels templates order page